
The Shape of Health Costs
At VizChitra 2026 in Bengaluru, I gave a 15-minute talk to a room of designers and data journalists. It was about a problem that sounds like statistics but is really about drawing: healthcare costs have a heavy tail, so the average lies — and the only honest way to show a tail is to draw every patient, nothing trimmed.
The talk is built on DataLabs, our public data-journalism project at Plum. We sit on real insurance-claims data for a country that mostly reports healthcare cost as a single number — "average treatment costs ₹X." DataLabs takes what's locked behind a login and draws it in the open: 17,636 claims · ₹226 Cr · two conditions (cancer and heart).
Every chart simplifies reality. The best ones carry complexity with care.
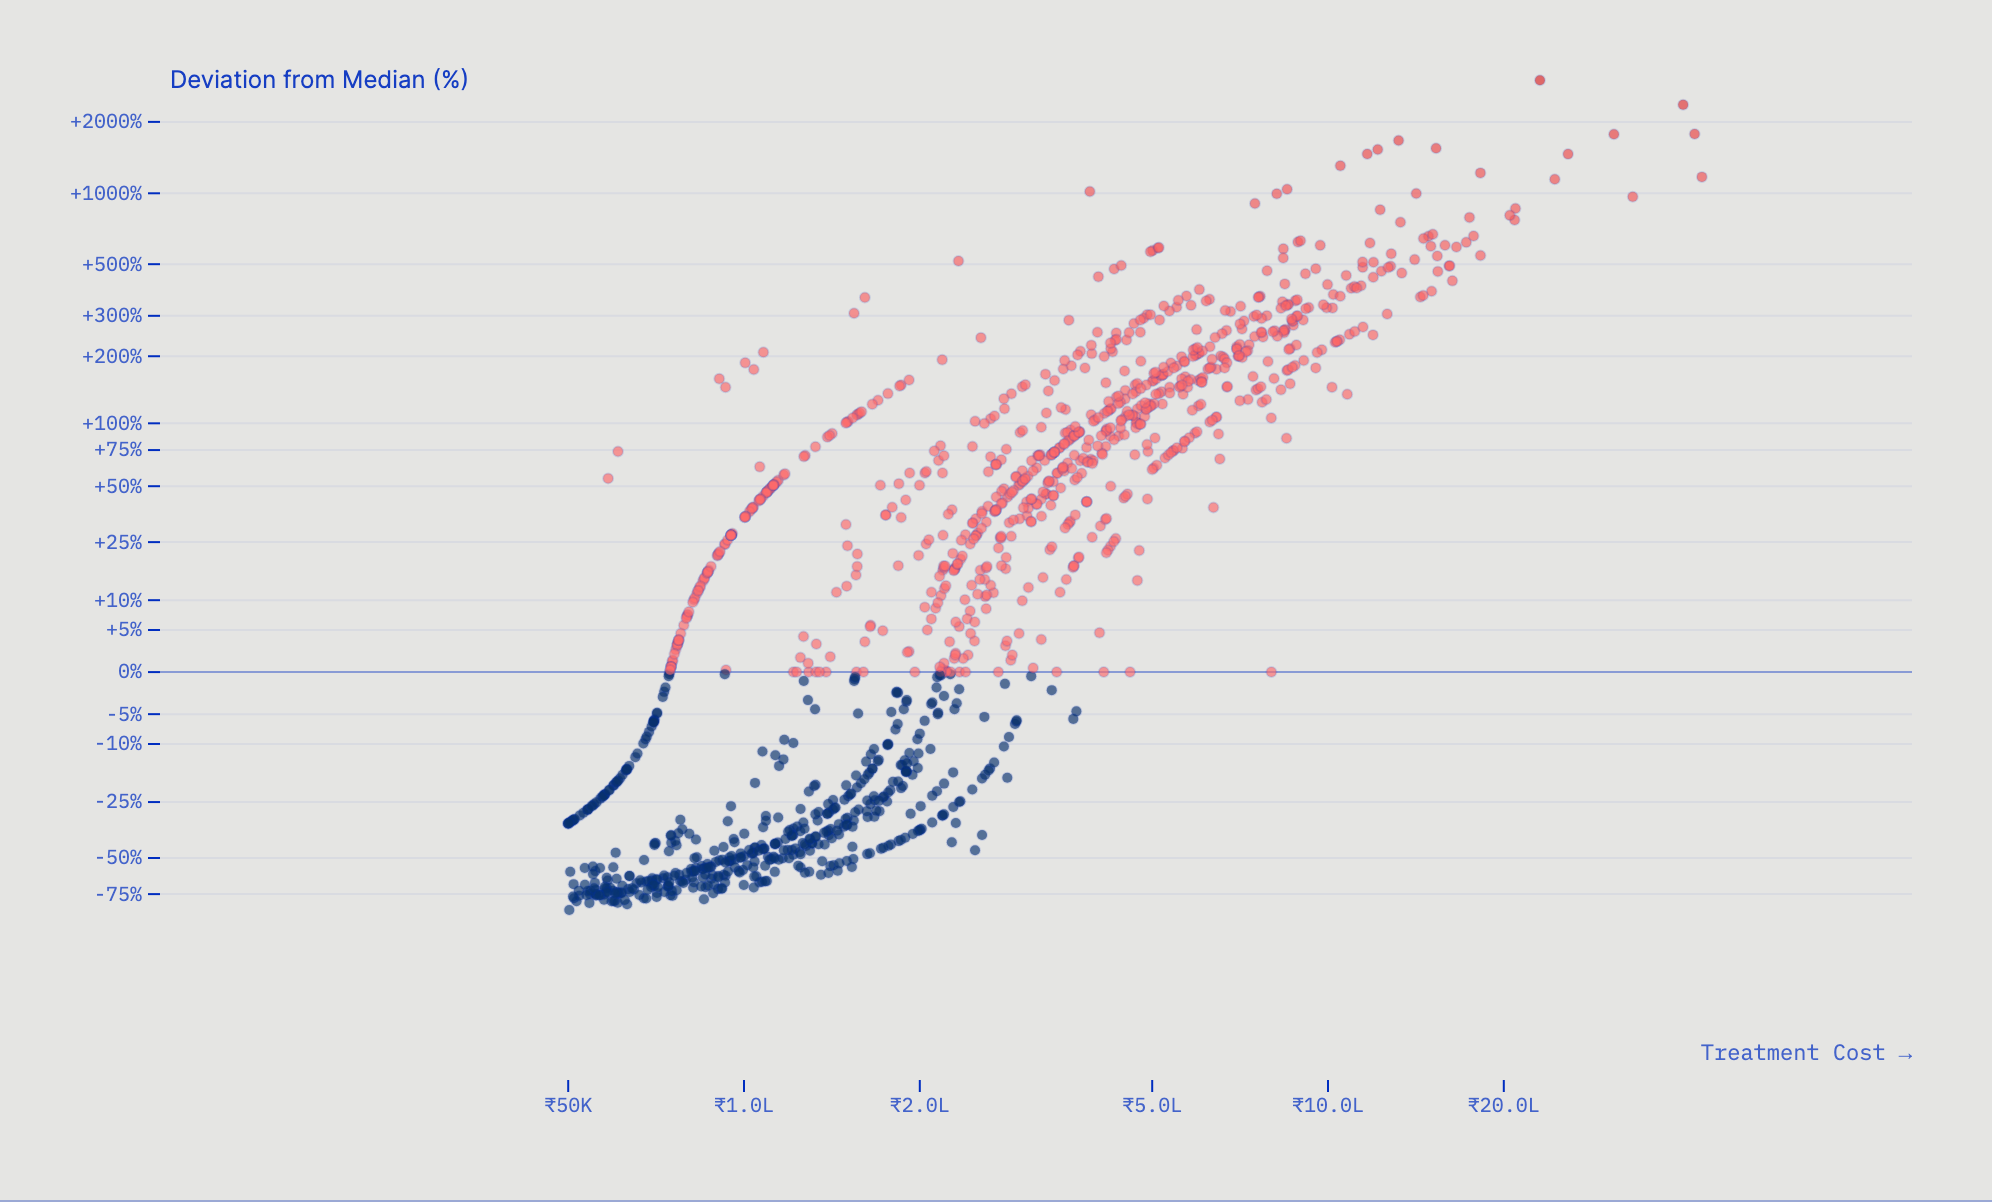
The shape itself — one dot per patient, nothing trimmed. Blue below the median, red above.
Rather than recap the slides, I want to hand you the thing underneath them. Alongside the deck I built a small sandbox to feel the math instead of taking it on faith — so here it is, live on the page.
The heavy-tail playground
Synthetic healthcare claims: a dense body of ordinary care plus a Pareto tail of catastrophes. Turn the dial α from mild to wild and watch three things break — the shape spreads, the average stops sitting still (hit 🎲 to re-roll the same scenario), and trimming the top few percent erases most of the money.
Lower α means a heavier tail. The rule that governs everything here: a statistic needs α greater than its power to exist — the mean needs α > 1, the variance needs α > 2. Real health costs sit at α ≈ 2, right on the cliff edge, so the variance is effectively infinite and "average ± a standard deviation" quietly stops meaning anything.
Start with the 🎗 Breast cancer α≈2 scenario, then re-roll a few times. The median holds steady; the mean and the standard deviation jump between draws. That instability isn't noise — it's the property of the shape. Then drag trim up to 5% and read the note: you delete a handful of patients and erase a quarter of all the money. Trimming the tail deletes exactly the people the cost question is about.
That's the whole argument for the charts we shipped: if the average can't summarize this and the tail can't be trimmed, the honest move is to show every observation.
Closing
The math forbids the easy summary, so care becomes the only honest option. A single number is how healthcare gets priced, budgeted, and written about — and for a heavy tail, it's the wrong number. Drawn with care, the same data stops being one company's spreadsheet and becomes a public argument.
Every chart simplifies reality. The best ones carry complexity with care.
Both editions — cancer and heart — are open at datalabs.plumhq.com. Come argue with the charts. We're also looking for collaborators for the next editions, so if any of this is your kind of problem, reach out.